
In a prior blog post, I alluded to a new strategy that interests me. It’s one that most will probably not agree with, which makes me like it even more. Please understand that what I’m about to write is not a recommendation for you, nor should it be considered financial advice.
Ever since reading Nassim Taleb’s book “The Black Swan
Tail risk is a form of portfolio risk that arises when the possibility that an investment will move more than three standard deviations from the mean is greater than what is shown by a normal distribution. – Investopedia
In theory, if stocks follow a normal distribution, moves of greater than three standard deviations from the mean should only happen about 0.3% of the time – a very rare event. However, studies have been shown that stocks do not follow a normal distribution and that these low probability events happen more often than expected. What’s interesting is that these events are both low probability and also high reward. I think a case can be made to profit from the “improbable” if one is both willing to absorb the short term costs and has the mental strength to remain disciplined for a long period of time where nothing but losses materialize (for years, potentially).
I want to walk you through some charts below that illustrate how put options behave when you have an explosion in volatility and rapid price decline – the same characteristics that one would expect in any financial crisis. But before we analyze the puts I want to set the stage by providing a clear picture (with charts) of the recent explosion in volatility and extreme price decline we experienced during the initial stages of the COVID-19 pandemic. To do so, I’m going to use SPY (ETF index fund of S&P 500) and VIX (the instrument used to measure overall volatility).
SPY
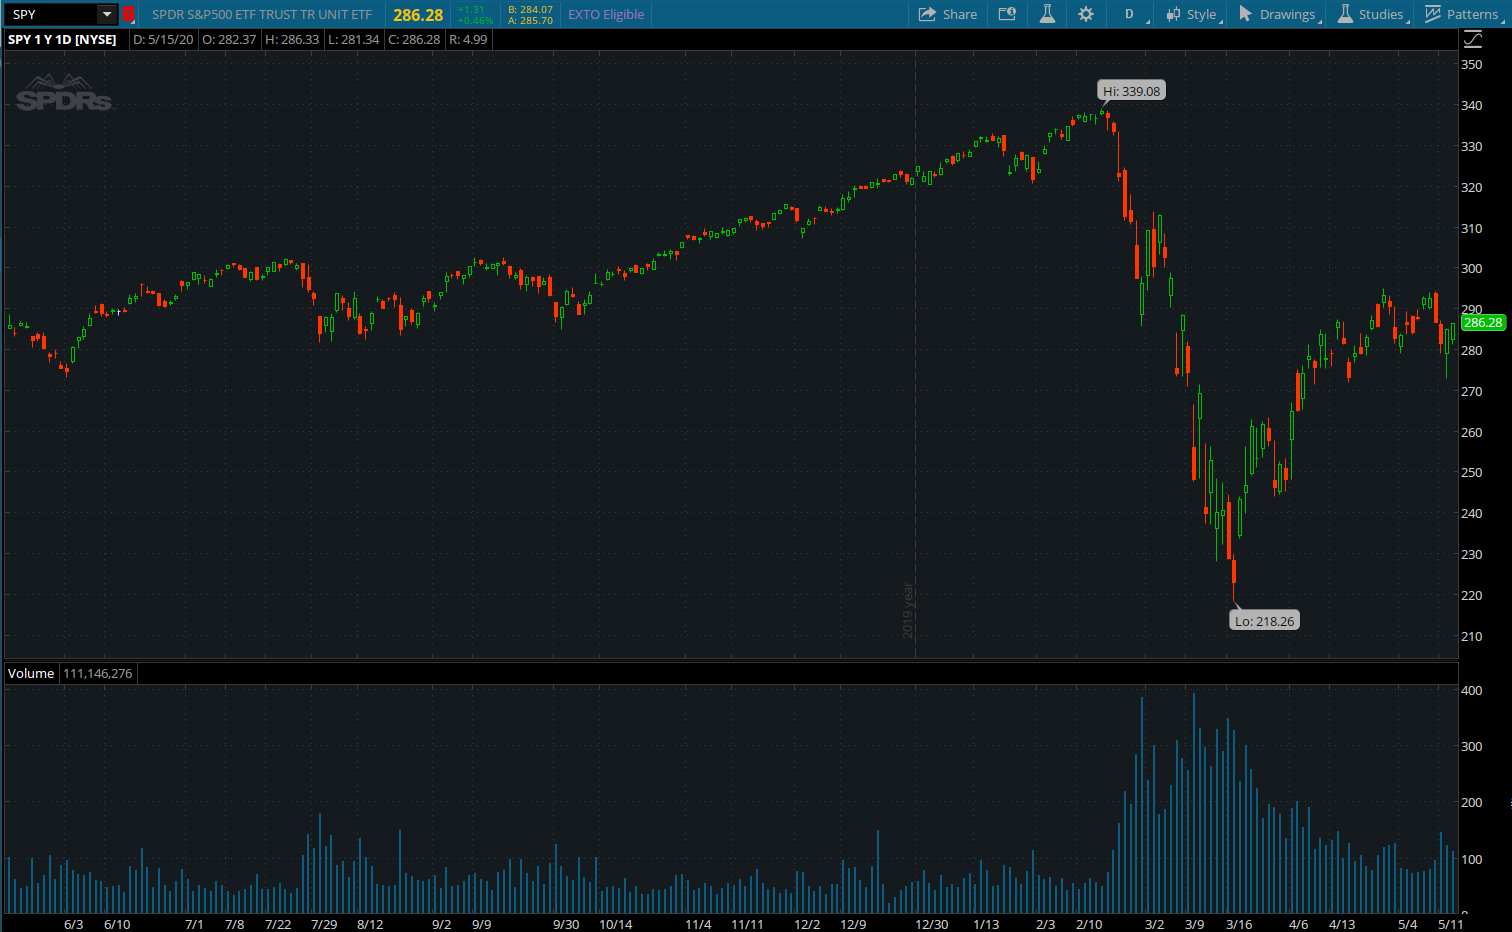
From the all-time high of $339.08 (peak – 2/19/20) to the low of $218.26 (trough – 3/23/20), this ETF declined 35.6% in just over a month – one of the fastest price declines on record. I think we can agree that this qualifies as a rapid decline in price.
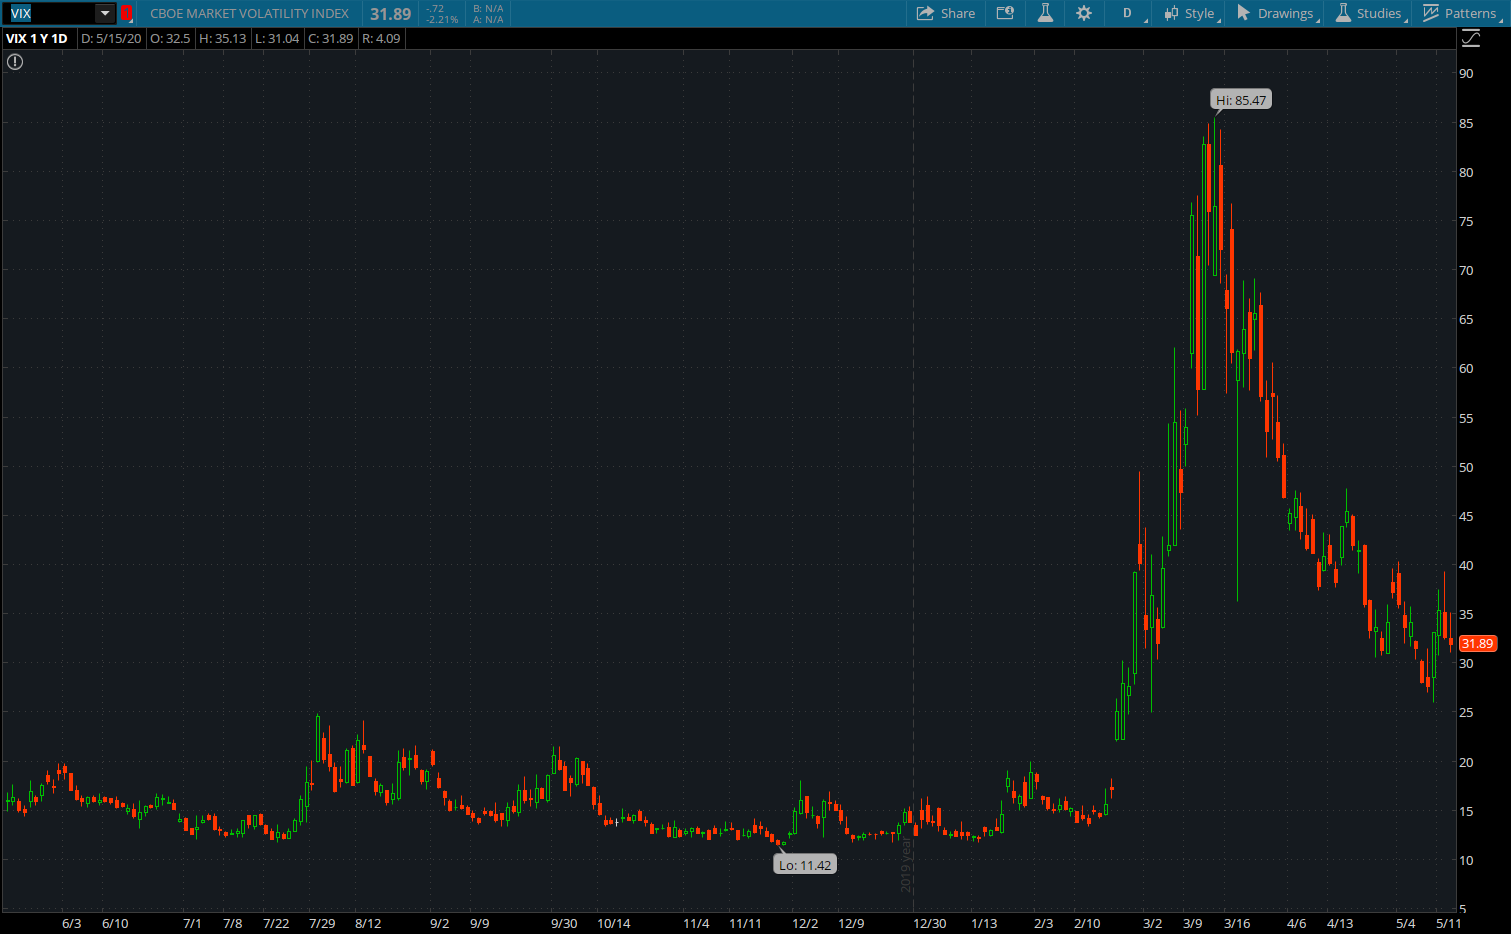
You will notice that like bonds and interest rates, SPY and VIX have an inverse relationship (when $hit hits the fan), in that when prices of SPY go up, the VIX typically declines and vice versa. That looks like an explosion in volatility to me!
So, we have the elements needed to move into how put options that are cheap and far out of the money (OTM) behave before, during, and after an explosion in volatility. The key to this strategy is buying these puts when they are extremely cheap. Depending on the length of any bull market it could become mentally draining buying these options and losing money on them for long periods of time. But as you are about to see, you don’t have to be right very often to recover the cost of these puts, and moreover, to make a handsome profit.
In the next set of charts, we are going to look at three different sets of expiration (when the puts expire) as well as three OTM strike prices: $200, $150, $100. I’m going to walk through what the range from low to high was and what that would mean in terms of risk to reward. I’m not suggesting that you or I could capture the entire move, but just to demonstrate how these perform in the context of a rapid 35% decline in the underlying and an explosion in volatility (north of 400% increase in VIX).
Note: for those unfamiliar with options, one option (contract) represents control of 100 shares of the underlying, therefore all the prices in the charts have a 100 multiplier in terms of translating the price of the contract into the cash value of the option. For example, an option with a price of $0.50 is worth $50.
January 2021 Expiration
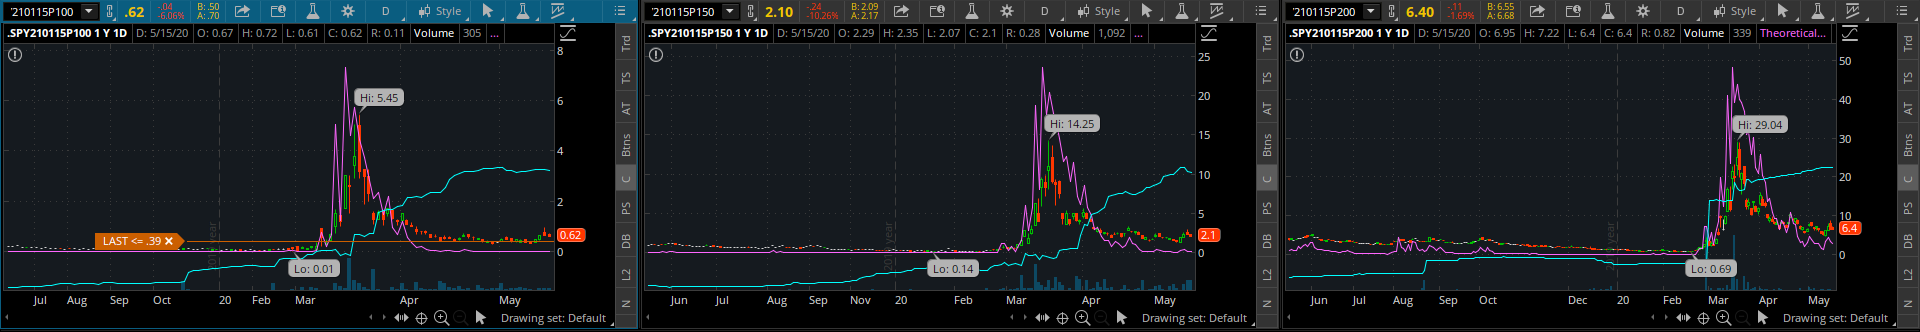
$100 Strike – $0.01 (low) to $5.45 (high), which for every $1,000 invested at the low would translate to $545,000 (545X return).
$150 Strike – $0.14 (low) to $14.25 (high), which for every $1,000 invested at the low would translate to $101,786 (102X return).
$200 Strike – $0.69 (low) to $29.04 (high), which for every $1,000 invested at the low would translate to $42,087 (42X return).
March 2021 Expiration
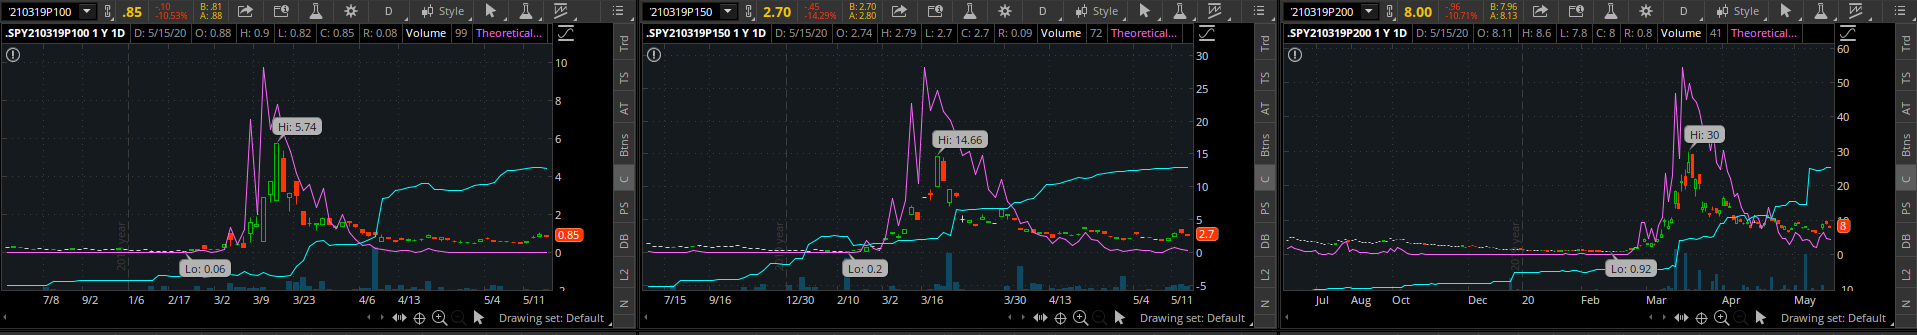
$100 Strike – $0.06 (low) to $5.74 (high), which for every $1,000 invested at the low would translate to $95,667 (96X return).
$150 Strike – $0.20 (low) to $14.66 (high), which for every $1,000 invested at the low would translate to $73,300 (73X return).
$200 Strike – $0.92 (low) to $30 (high), which for every $1,000 invested at the low would translate to $32,609 (33X return).
June 2021 Expiration

$100 Strike – $0.11 (low) to $7.39 (high), which for every $1,000 invested at the low would translate to $67,182 (67X return).
$150 Strike – $0.33 (low) to $14.50 (high), which for every $1,000 invested at the low would translate to $43,939 (44X return).
$200 Strike – $1.27 (low) to $29.84 (high), which for every $1,000 invested at the low would translate to $23,496 (23X return).
Conclusions
The tricky thing about buying options vs. selling them is that you have to be right in direction, within a finite amount of time (dictated by the contract expiration date), and in your assumptions around volatility (particularly on downside moves). I’ve historically only been an option seller – selling cash-secured puts and selling covered calls – for this very reason. And with this strategy that requires buying options that are extremely out of the money you don’t actually have the full time to expiration for your hedge strategy to work. For example, the same $100 strike put with April 2020 expiration was only trading for $0.12 on March 23rd (the day the lows in the market were set). This is because there wasn’t enough time or belief that within another month that the market would be cut by more than half from an already deep 35% decline off the lows.
So, it is a delicate balance of finding the cheapest out of the money option with the right amount of time to expiration.
I personally chose to buy the $100 Strike options with January 2021 expiration. With elevated volatility, there were plenty of opportunities to trade around the position (if you’re into that kind of thing). I did just that and I currently own 100 put contracts with a cost basis of negative $0.11 per option. At the start of this, I was willing to risk between $5,000 to $10,000 per year on this particular trade as a hedge against all my other investments (including the performance of my business). Therefore, I never let my trade size exceed this amount of risk capital in terms of absolute cash outlay for the hedge.
I’m currently in the hedge for better than free, but time is not working for me. Once the Q2 earnings season is over I will have to think about rolling this position out to a further date. I originally started trading these options in late April after we had seen a significant bounce in the market. In a perfect situation, I would have already owned some of these prior to the Pandemic. In the future, I would ideally own this type of hedge for a nickel or less (with a minimum of nine months to expiration or as far out as I can stay within that price range).
Again, I don’t recommend anyone follow me into this. Instead, I just wanted to share what I was doing and document my thought process. The risk is very minimal in terms of our overall net worth and to me the small cost of the hedge is worth the peace of mind to keep investing aggressively with the rest of our capital. It also gives me peace of mind knowing that if/when we do have another crisis that could impact my family’s livelihood (our investments and my business) that I have something in place to help mitigate that.
– Gen Y Finance Guy
6 Responses
Great article as always. Question on your execution of these trades – Do you hold these all the way to expiration? Or are you rolling them forward at certain intervals in order to lower your overall cost of holding these puts?
Hey Luke – it wouldn’t make sense to hold them until expiration because they will most likely expire worthless. The closer they get to expiration the less effective and sensitive they are to moves in price and volatility. I’ll be looking to roll them in the next couple of weeks (after Q2 earnings season).
Hi – I’ve looked into employing such a hedge strategy but I find that the put options are so much more expensive now than the pre-COVID days. I would imagine this is due to the increase in volatility.
Even if the stock market melts the way it did back in March, do you think those options would reach the same highs as the ones you have identified?
Hey Rich – Yes, the puts have gotten more expensive because of the heightened level of uncertainty = volatility is elevated.
I actually rolled my January 2021 puts out to June of 2021 as once the option is within six months it will begin losing its sensitivity to price declines and volatility expansions. It will still move but the leverage of the move won’t be as great.
It’s more ideal to have purchased these before the explosion in volatility. That said, I happen to trade around the position and although I paid $0.46 per option ($100 strike on SPY with June expiration) my effective cost basis is actually $0.14 per option based on the net gain from trading around the core hedge position. I’ll likely be looking to roll out further in another 2-3 months if we don’t get a big move to the downside…who knows as we head into the election.
Dom
Could you expand more around what you mean by “trade around the position” to lower your cost basis? Does this mean you are buying/selling the same put option to take advantage of short-term fluctuations? Thanks.
Hey Ryan,
Yes, I buy and sell additional puts around my core position of 100 puts. For example, at one point I had 300 of these pits and shaved off 200 for a profit that covered the cost of the 100 I didn’t want to go below.
Also keep me in mind that managing time to expiration is super important. I now currently hold the same strike puts with December 2021 expiration.